Chlorophyll-a concentration observed by "Shikisai (GCOM-C)"
Last Update: 2024/03/26Information
2024/3/26:The observation results up to February 27, 2024 have been added.
2023/12/13:The observation results up to November 28, 2023 have been added.
2023/9/25:The observation results up to August 29, 2023 have been added.
2023/6/8:The observation results up to May 30, 2023 have been added.
2023/3/16:The observation results up to February 28, 2023 have been added.
2023/2/21:The observation results up to January 31, 2023 have been added.
2023/1/26:The observation results up to January 3, 2023 have been added.
2022/12/7:The observation results up to November 29, 2022 have been added.
2022/11/24:The observation results up to November 1, 2022 have been added.
2022/10/24:The observation results up to October 4, 2022 have been added.
2022/9/6:The observation results up to August 30, 2022 have been added.
2022/8/19:The observation results up to August 2, 2022 have been added.
2022/7/27:The observation results up to June 28, 2022 have been added.
2022/3/29:The observation results up to March 22, 2022 have been added.
2022/3/8:Observation results of second half of February 2022 were added.
2022/2/8:Observation results of second half of January 2022 were added.
2022/1/14:Observation results of second half of December 2021 were added.
2021/12/13:Observation results of second half of November 2021 were added.
2021/11/10:Observation results of second half of October 2021 were added.
2021/10/15:Observation results of second half of September 2021 were added.
2021/09/14:Observation results of second half of August 2021 were added.
2021/07/30:Observation results of second half of June 2021 were added.
2021/06/16: Observation results of second half of May 2021 were added.
2021/06/02: Observation results of second half of May 2021 were added.
2021/05/14: Observation results of first half of May 2021 were added.
2021/04/02: Observation results of second half of March 2021 were added.
2021/03/19: Observation results of first half of March 2021 were added.
2021/03/05: Observation results of second half of February 2021 were added.
2021/02/22: Observation results of first half of February 2021 were added.
2021/02/15: Observation results of first half of February 2021 were added.
2021/02/05: Observation results of second half of January 2021 were added.
2021/02/03: Observation results of first half of January 2021 were added.
2020/12/25: Observation results of second half of December 2020 were added.
2020/12/21: Observation results of first half of December 2020 were added.
2020/12/07: Observation results of second half of November 2020 were added.
2020/11/20: Observation results of first half of November 2020 were added.
2020/10/22: Observation results of first half of October 2020 were added.
2020/10/05: Observation results of September 2020 were added.
2020/09/15: Observation results of second half of August 2020 were added.
2020/08/25: Observation results of first half of August 2020 were added.
2020/08/11: Observation results of Osaka bay and Ise bay were added. The observation period was extended to July 2020 and the total suspended matter concentration (TSM) was added.
2020/06/25: This article was released.
Overview
GCOM-C Chlorophyll-a concentration (Chl-a) in Tokyo, Osaka and Ise bays. Chl-a in 2023 showed similar changes as ones between 2018 and 2022.
Observation and Analysis Results
Chlorophyll-a concentration (Chl-a, mg/m3) and its anomaly (Chl-a difference from the reference climatological values (shown by %) derived from GCOM-C satellites (the collaborative analysis with Sentinel-3, and Aqua about the North Adriatic Sea are shown in the trilateral dashboard) is used as an index to assess and monitor the potential effects of the lockdown, and subsequent recovery, on inland and coastal water quality. Chl-a is an indicator of phytoplankton abundance which fluctuates naturally with nutrient, solar irradiance, and water temperature, and so on. Chl-a is commonly used as a proxy for water quality in coastal areas because it is strongly influenced by river runoff and human activities, such as the discharge of urban sewage and agriculture fertilizers.
The Chl-a indicators in Tokyo Bay, Osaka Bay and Ise Bay are displayed as examples of the coastal areas near the biggest cities. The Chl-a indicators are changed by the nutrient from rivers varied by rainfall in the drainage basin, solar irradiance, water temperature, and surface winds which cause the mixing, drifting, and upwelling of the sea water. Because the satellite Chl-a estimate can be influenced by light absorption of dissolved organic matter in the bay areas, similar indicator by the total suspended matter concentration (TSM) is shown as the same way.
The indicators of the target area sometimes take large variation mainly due to the inflow of river water (e.g., early Apr. 2018, middle-late Oct 2019, early Aug. 2020, and early Jan. and May 2020 in Tokyo bay: Sep. 2018 and middle Jan. 2020 in Osaka Bay: early Mar. and Sep. 2018, late Aug. 2019, middle Feb. and late Apr. 2020, and Apr. 2021 in Ise Bay), while there were no relationship with behavioral restrictions period in the surrounding area. That may show there is no significant influence on the coastal environment and ecosystem, even though the indicators cannot detect ones smaller than several hundred-meter scales.
Observation and Analysis Results (Tokyo Bay)
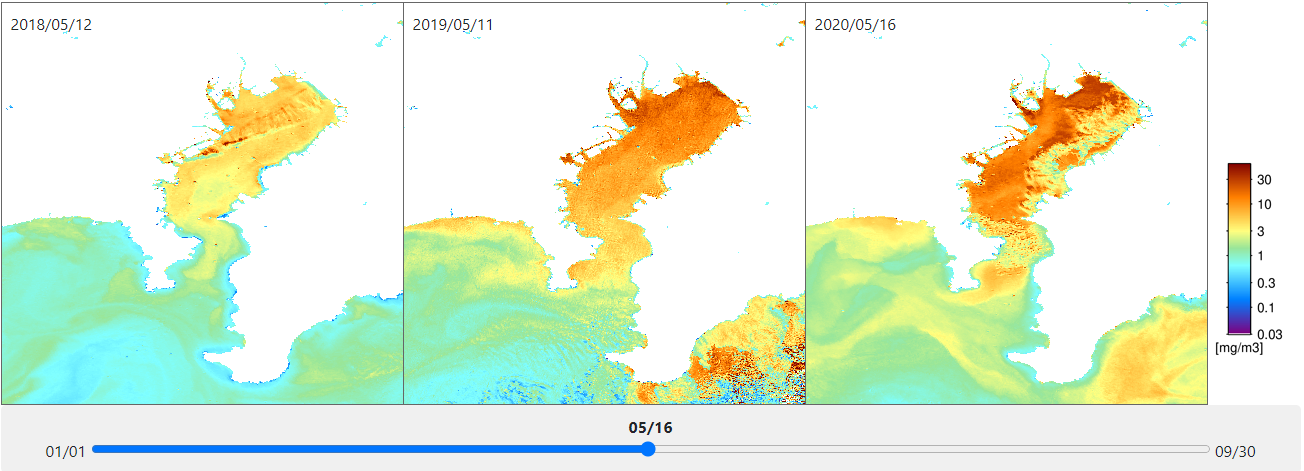
Fig 1-1: Example of yearly comparison of chlorophyll-a concentration in Tokyo Bay
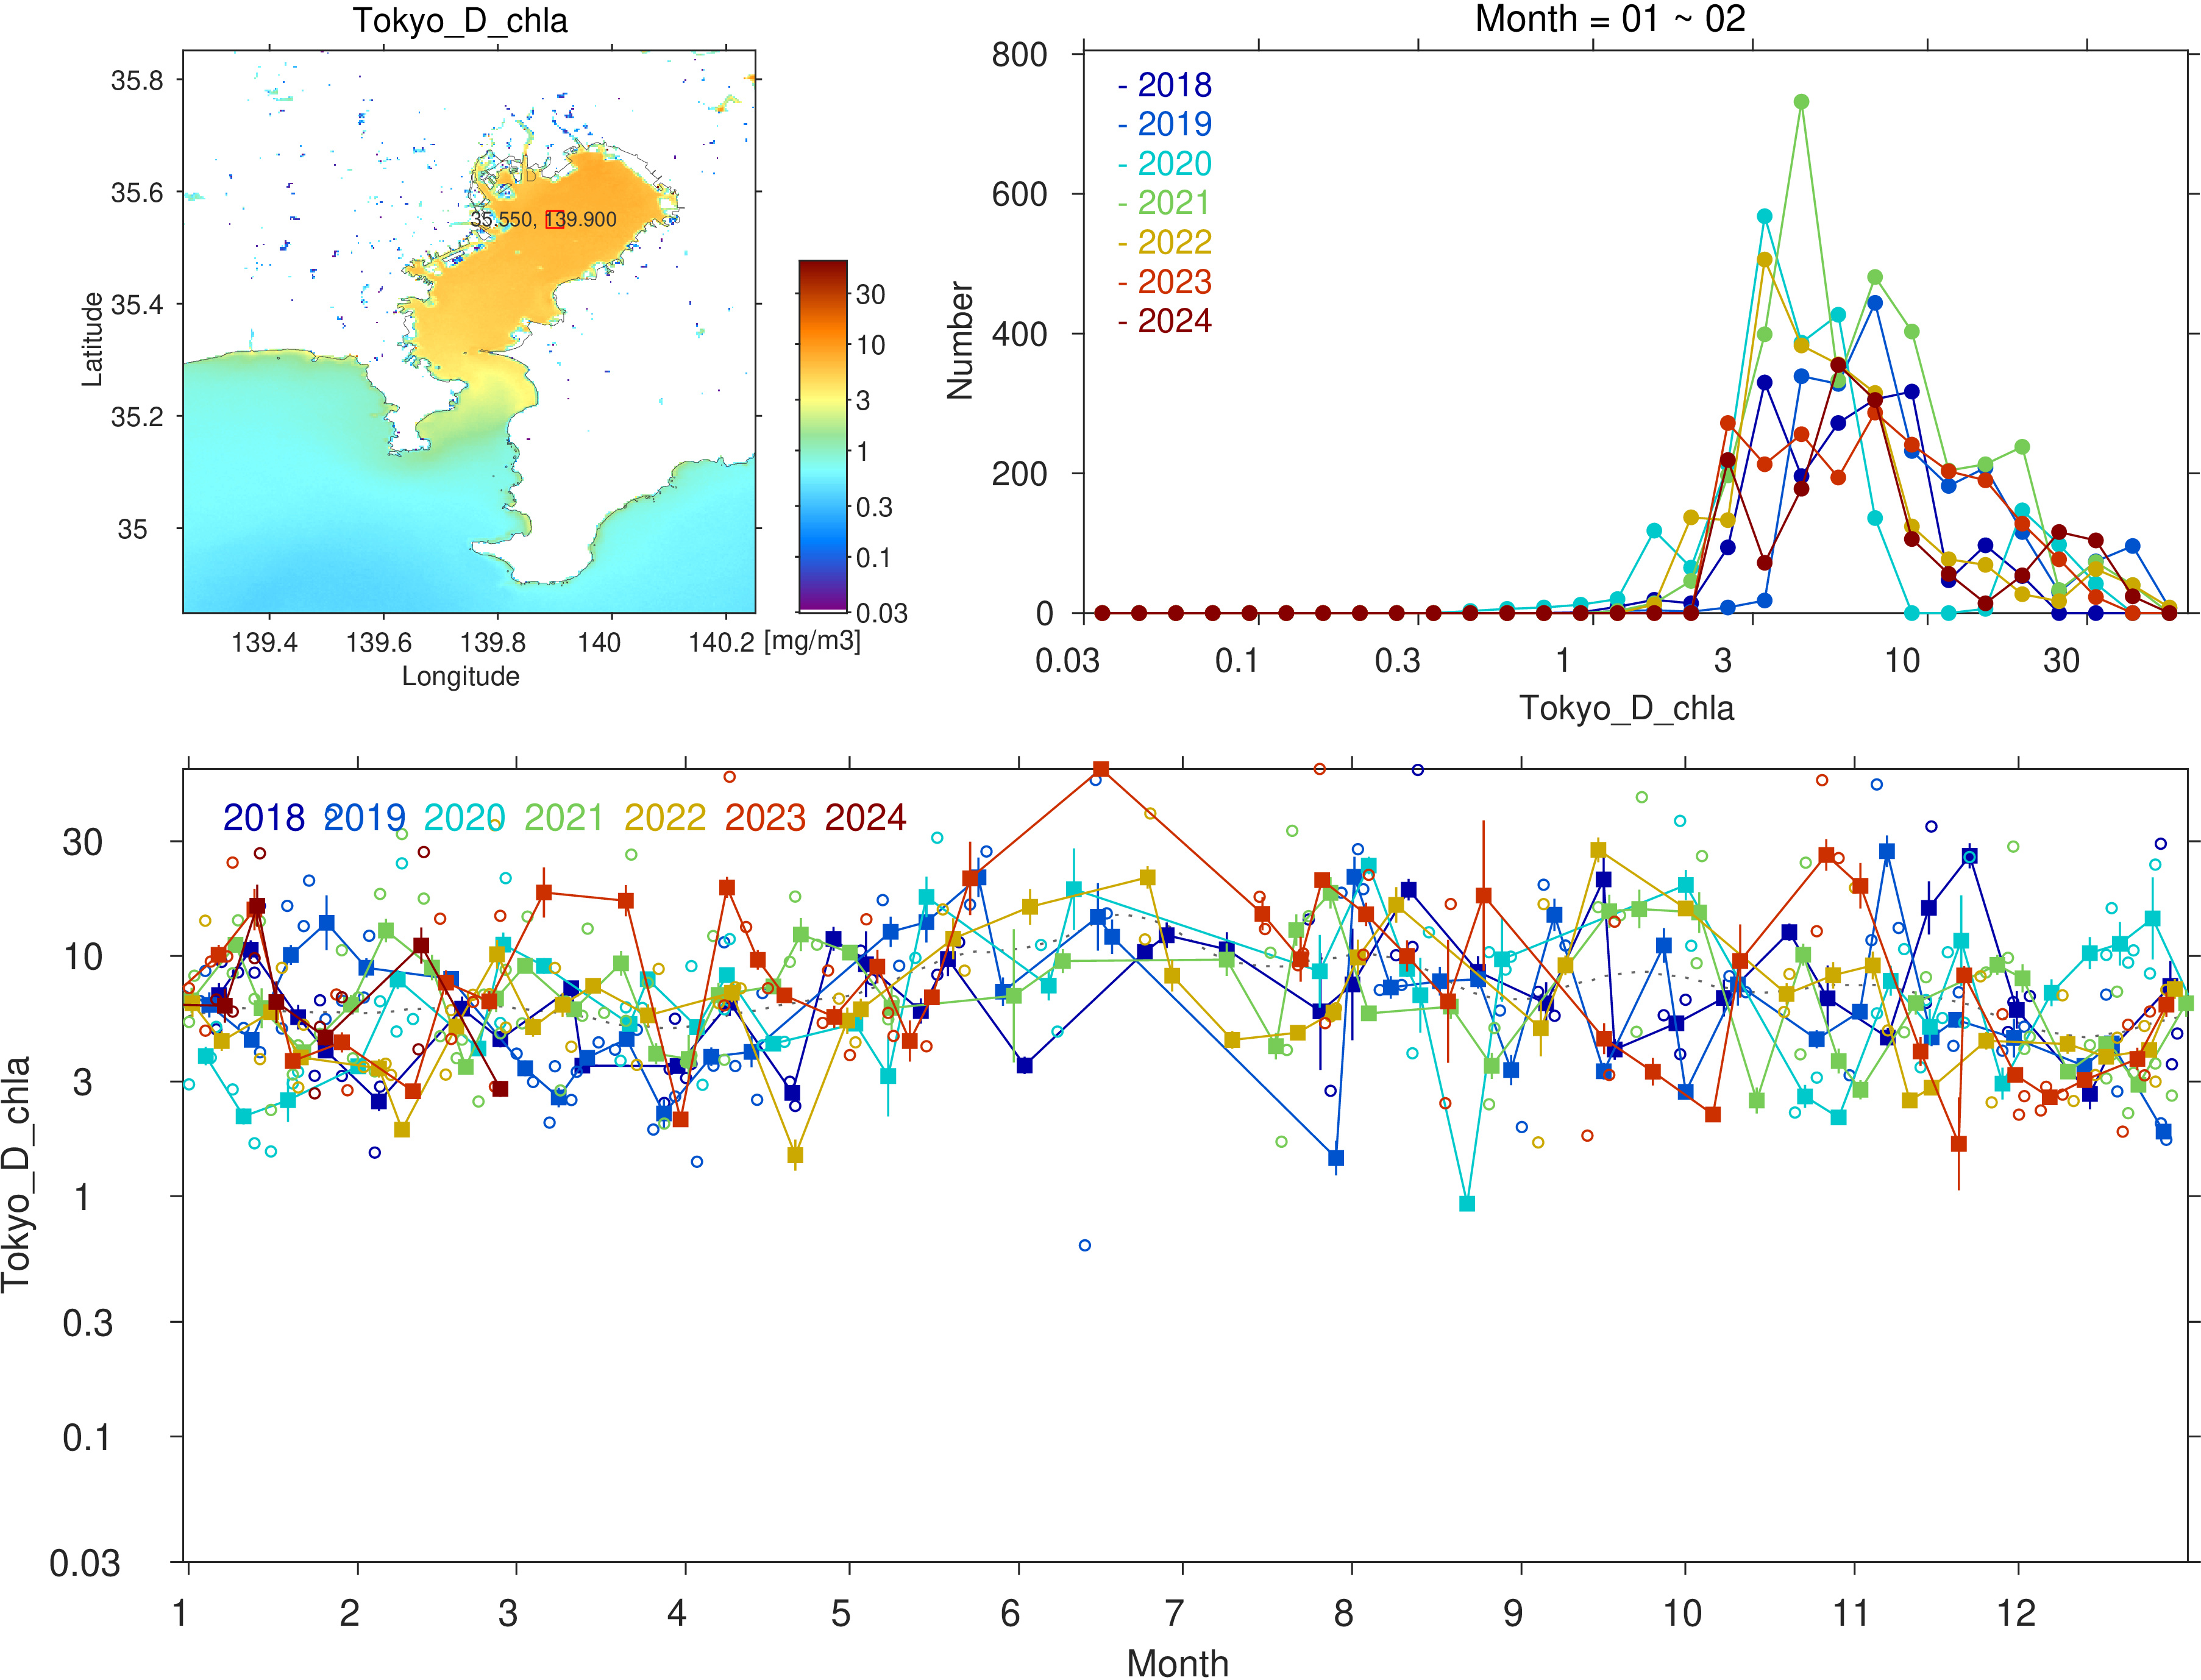
Fig 1-2: Time series change of chlorophyll-a concentration in Tokyo Bay
The top right figure shows the average histogram of the red square field in the top left figure. The bottom figure shows its time-series change. Blue, green, yellow, and red lines show the values of 2018, 2019, 2020, and 2021 respectively. In the bottom figure, blue, green, and red circles show the values of each day. The solid lines show weekly average values and the dotted line shows the values of the moving average of +/- 10 days from 2018 to 2019.
Fig 1-3: Yearly comparison of the total suspended matter concentration (TSM) in Tokyo Bay
Fig 1-4: Time series change of the total suspended matter concentration (TSM) in Tokyo Bay
Observation and Analysis Results (Osaka Bay)
Fig 2-1: Yearly comparison of chlorophyll-a concentration in Osaka Bay
Fig 2-2: Time series change of chlorophyll-a concentration in Osaka Bay
Fig 2-3: Yearly comparison of the total suspended matter concentration (TSM) in Osaka Bay
Fig 2-4: Time series change of the total suspended matter concentration (TSM) in Osaka Bay
Observation and Analysis Results (Ise Bay)
Fig 3-1: Yearly comparison of chlorophyll-a concentration in Ise Bay
Fig 3-2: Time series change of chlorophyll-a concentration in Ise Bay
Fig 3-3: Yearly comparison of the total suspended matter concentration (TSM) in Ise Bay
Fig 3-4: Time series change of the total suspended matter concentration (TSM) in Ise Bay
Download
FTP Site (PNG, JPG, Text File)
Terms of use is applied to the data for download.