CO2 Changes over Urban Areas observed by "GOSAT"
Detection of changes in methane concentration in Bakersfield, California, USA from the "IBUKI"
CO2 Changes over Urban Areas observed by "GOSAT"
Last Update: 2020/6/25Overview
GOSAT observes CO2 enhancement changes over large urban areas. The CO2 enhancement in 2020 is smaller than the previous years.
Observation and Analysis Results
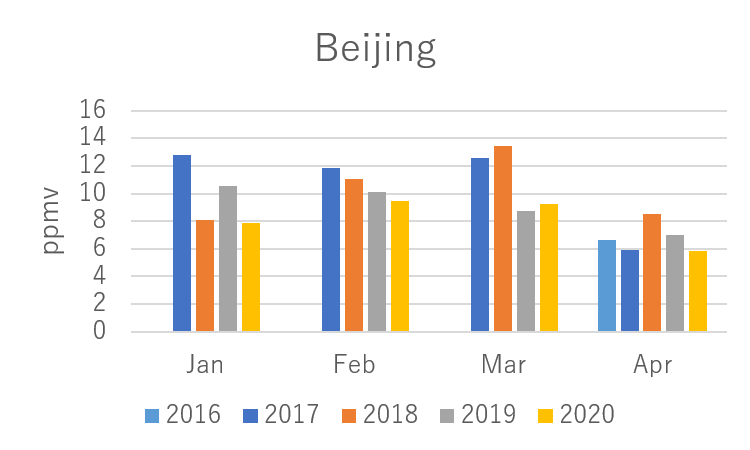
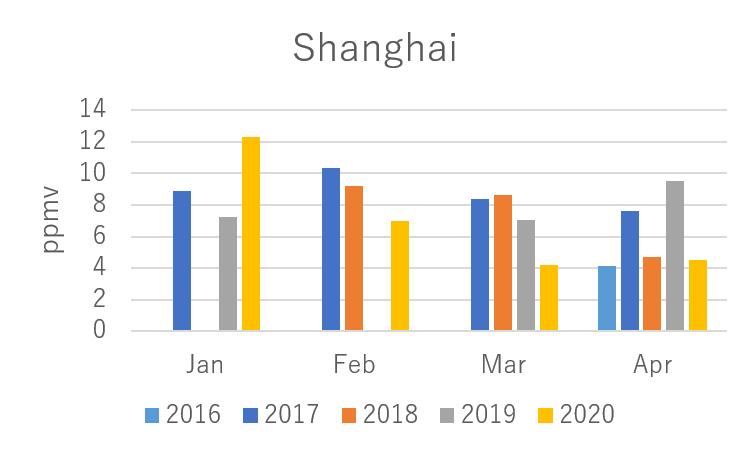
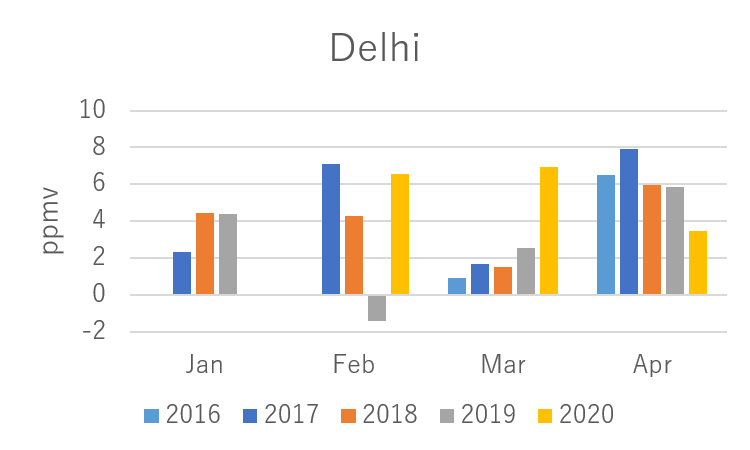
The largest changes in economic activity associated with the COVID-19 pandemic have been reported in the large urban areas where most people live and work. We derived monthly averages of CO2 enhancements related to CO2 flux index over Tokyo, New York, Beijing, Shanghai, Delhi, Mumbai and Dhaka for January through April of each year from 2016 through 2020 by using GOSAT CO2 tropospheric partial column density products. The monthly average CO2 enhancements over these seven large cities are shown in the bar graphs and the target maps from GOSAT observations. While the CO2 enhancements vary from month to month, they are generally smaller in 2020 than in earlier years.
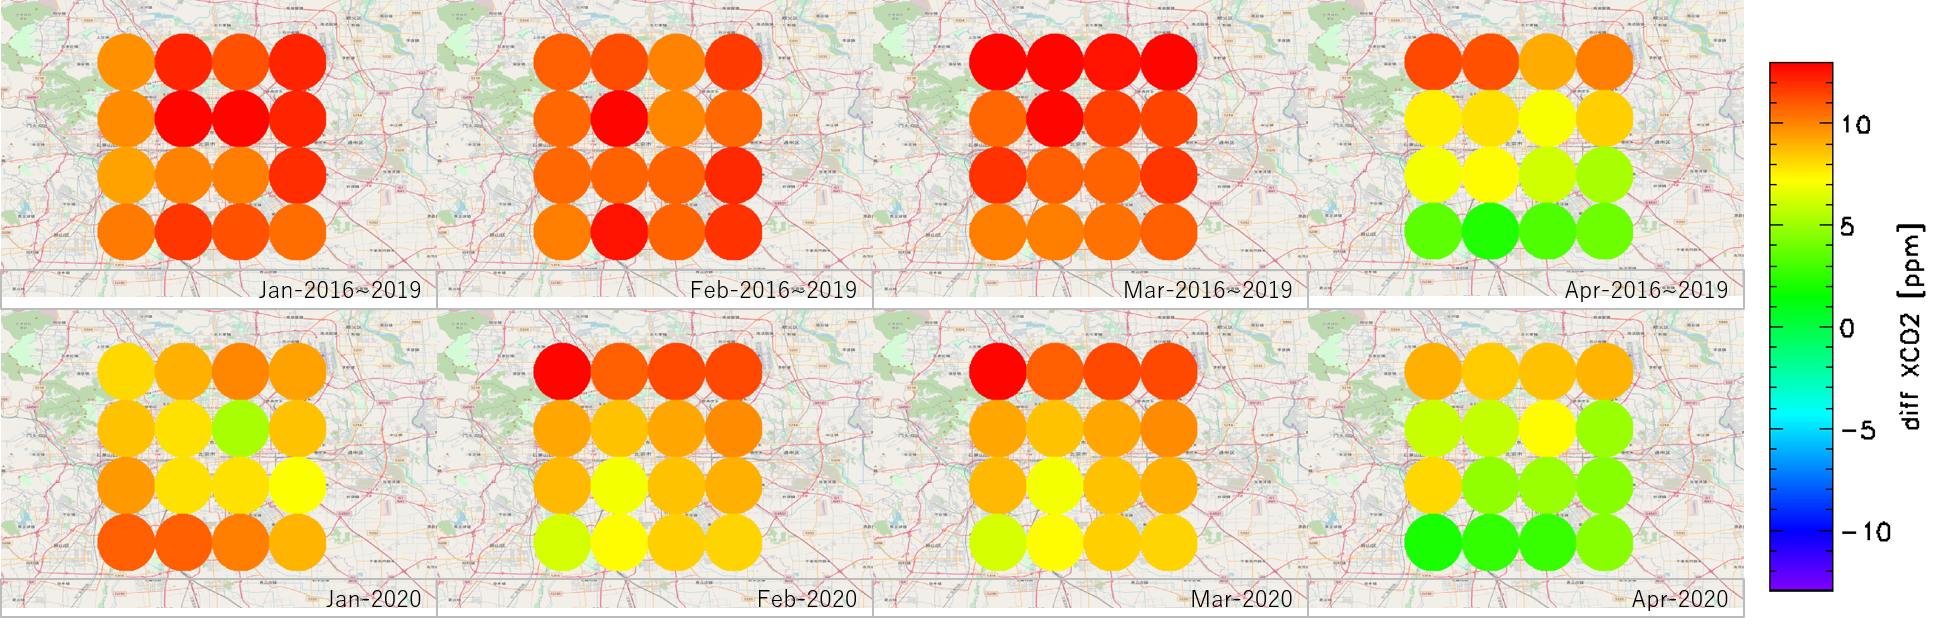
The results for each month in 2016-2019 were averaged together to produce a background climatology of CO2 enhancements over the city. Results for January through April of 2020 are compared to corresponding results from the 2016-2019 climatology for each city. Here, all months in 2020 show reduced CO2 enhancements relative to prior years. While this behavior is consistent with the reported COVID-19-related reductions fossil fuel emissions, it is important to remember that these atmospheric results include contributions from photosynthesis and respiration from the land biosphere within and near the city as well as fossil fuel emissions.
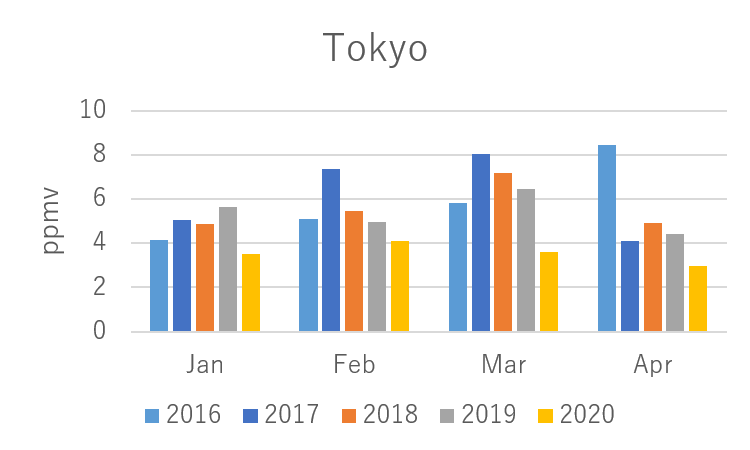
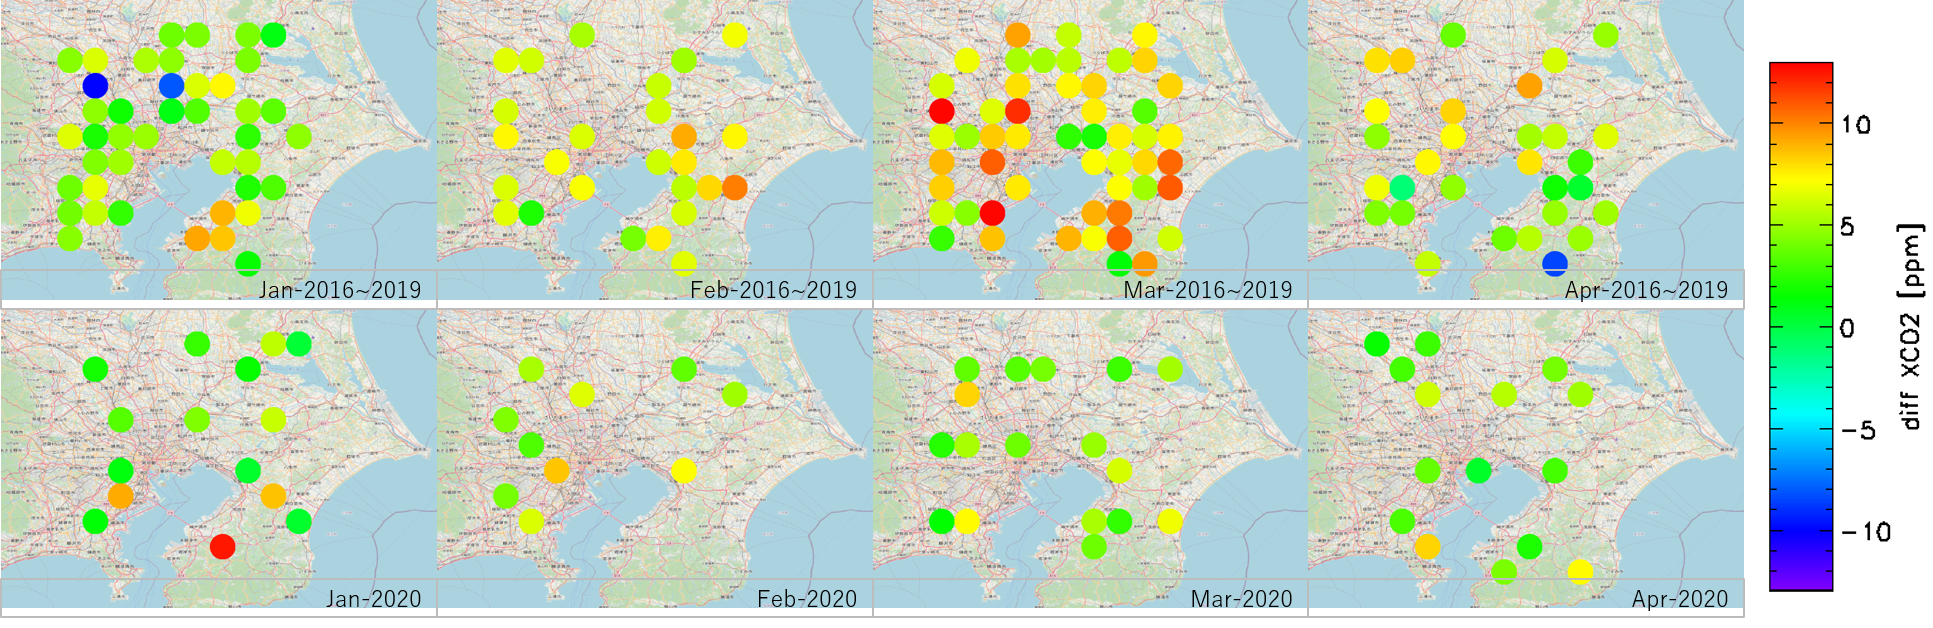
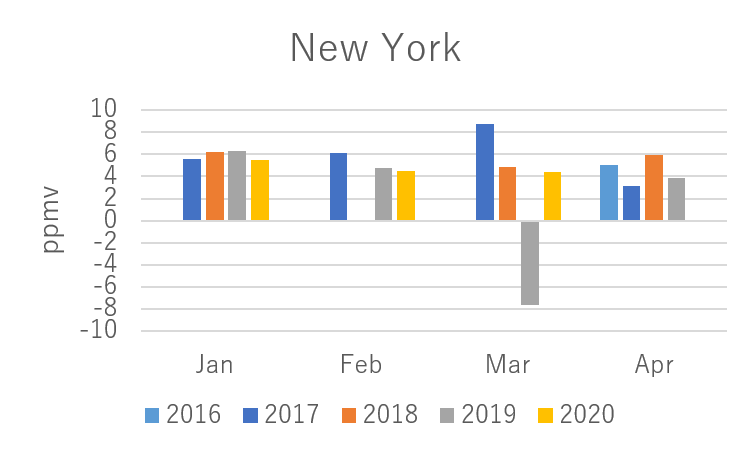
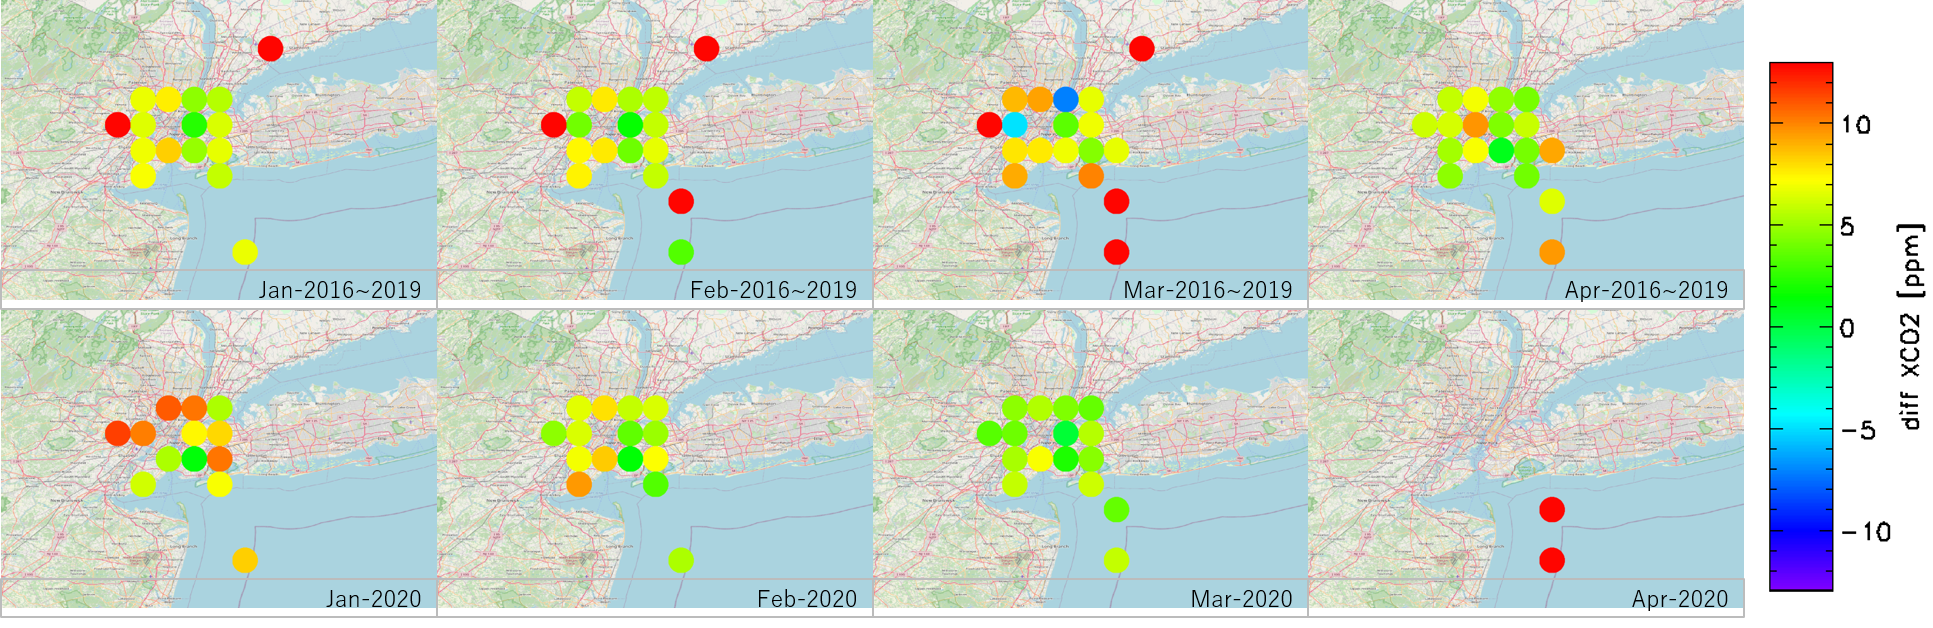
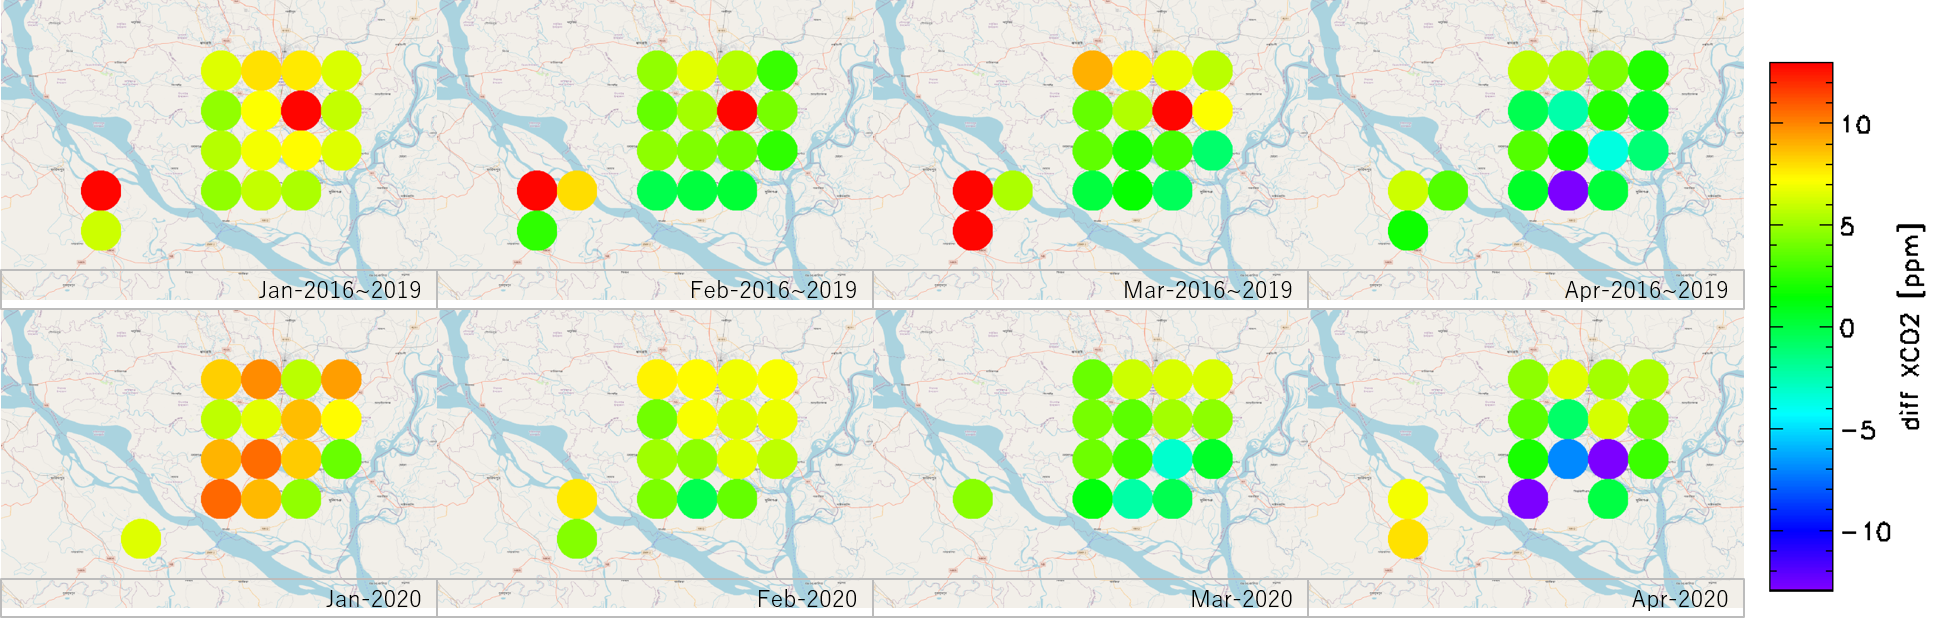
For Tokyo, CO2 values were similar in January and February 2020, and lower in March and April relative to prior years, as the self-restraint began to be imposed. For New York, the partial column CO2 values were higher in January 2020, similar February, and lower in March, as the lockdowns began to be imposed. There is no data in April due to cloud cover. Beijing and Shanghai show reduced CO2 in February – April 2020, as the citywide restrictions began to be imposed. In Delhi, Mumbai and Dhaka, the story is somewhat more mixed. The lower tropospheric CO2 is lower or almost the same in February, reflected the large scale biospheric influences. In March 2020, the lower tropospheric values are higher than in earlier years in Delhi, and lower in Mumbai and Dhaka. The 2020 values fall across all three cities in April, as the lockdowns are implemented. However, these changes are very difficult to attribute to the pandemic because of the large scale natural CO2 changes seen across India during this season.
Observation and Analysis Results (Tokyo)
Analyzed by JAXA/EORC
Fig 1-1: Monthly lower tropospheric CO2 enhancements chart over Tokyo for January through April
Analyzed by JAXA/EORC
Fig 1-2: Monthly lower tropospheric CO2 enhancements map over Tokyo for January through April 2020 compared with the 2016-2019 monthly climatology
(GOSAT target observations are shown in color-coded circles of 10 km diameter field of view.)
Observation and Analysis Results (New York)
Analyzed by JAXA/EORC
Fig 2-1: Monthly lower tropospheric CO2 enhancements chart over New York for January through April
Analyzed by JAXA/EORC
Fig 2-2: Monthly lower tropospheric CO2 enhancements map over New York for January through April 2020 compared with the 2016-2019 monthly climatology
(GOSAT target observations are shown in color-coded circles of 10 km diameter field of view.)
Observation and Analysis Results (Beijing)
Analyzed by JAXA/EORC
Fig 3-1: Monthly lower tropospheric CO2 enhancements chart over Beijing for January through April
Analyzed by JAXA/EORC
Fig 3-2: Monthly lower tropospheric CO2 enhancements map over Beijing for January through April 2020 compared with the 2016-2019 monthly climatology
(GOSAT target observations are shown in color-coded circles of 10 km diameter field of view.)
Observation and Analysis Results (Shanghai)
Analyzed by JAXA/EORC
Fig 4-1: Monthly lower tropospheric CO2 enhancements chart over Shanghai for January through April

Analyzed by JAXA/EORC
Fig 4-2: Monthly lower tropospheric CO2 enhancements map over Shanghai for January through April 2020 compared with the 2016-2019 monthly climatology
(GOSAT target observations are shown in color-coded circles of 10 km diameter field of view.)
Observation and Analysis Results (Delhi)
Analyzed by JAXA/EORC
Fig 5-1: Monthly lower tropospheric CO2 enhancements chart over Delhi for January through April
Analyzed by JAXA/EORC
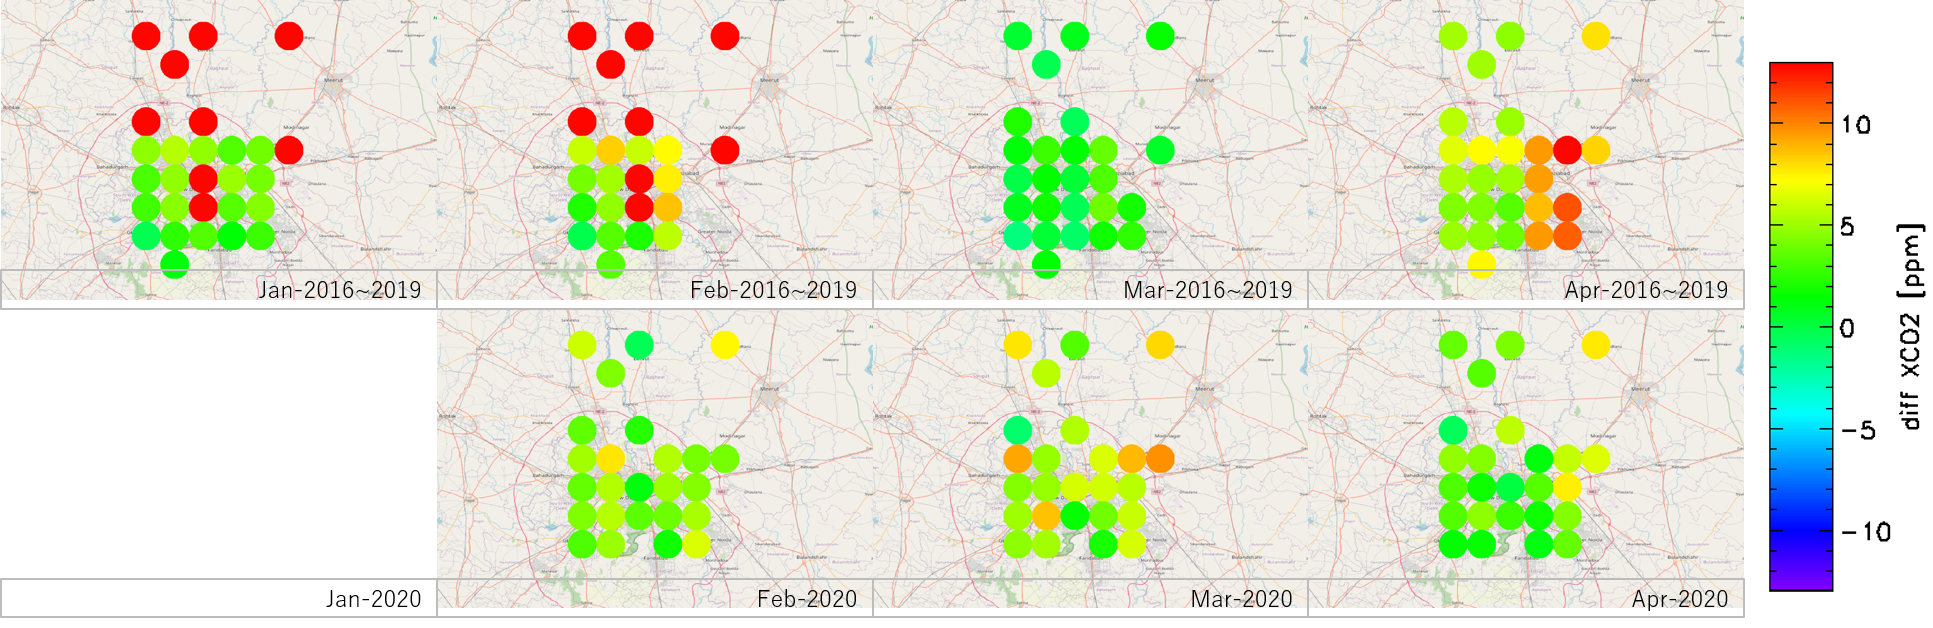
Fig 5-2: Monthly lower tropospheric CO2 enhancements map over Delhi for January through April 2020 compared with the 2016-2019 monthly climatology
(GOSAT target observations are shown in color-coded circles of 10 km diameter field of view.)
Observation and Analysis Results (Mumbai)
Analyzed by JAXA/EORC
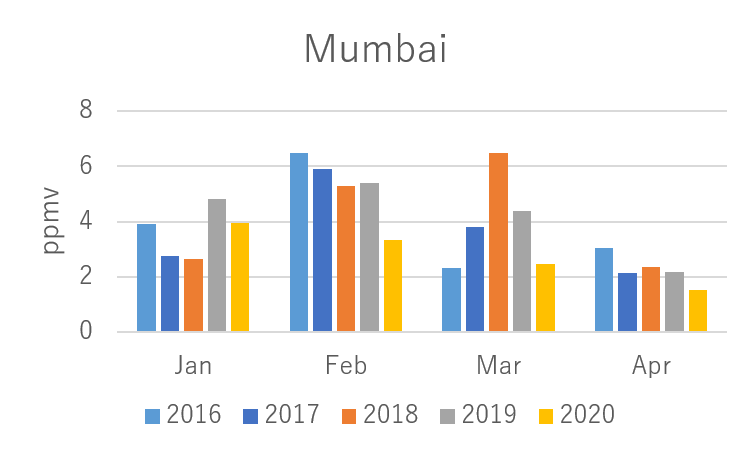
Fig 6-1: Monthly lower tropospheric CO2 enhancements chart over Mumbai for January through April
Analyzed by JAXA/EORC
Fig 6-2: Monthly lower tropospheric CO2 enhancements map over Mumbai for January through April 2020 compared with the 2016-2019 monthly climatology
(GOSAT target observations are shown in color-coded circles of 10 km diameter field of view.)
Observation and Analysis Results (Dhaka)
Analyzed by JAXA/EORC
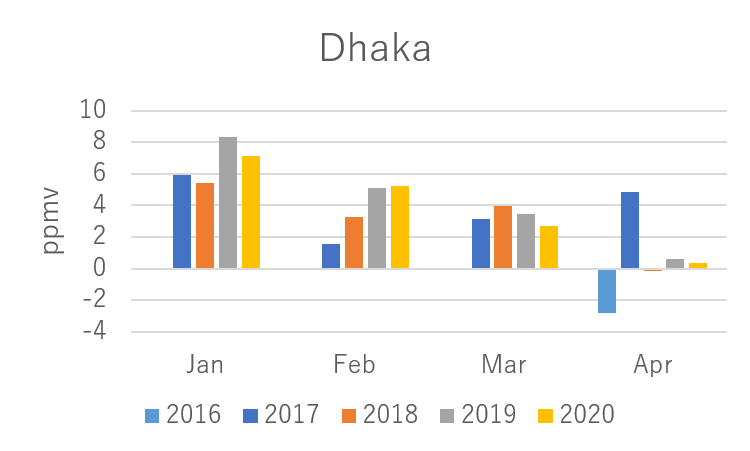
Fig 7-1: Monthly lower tropospheric CO2 enhancements chart over Dhaka for January through April
Analyzed by JAXA/EORC
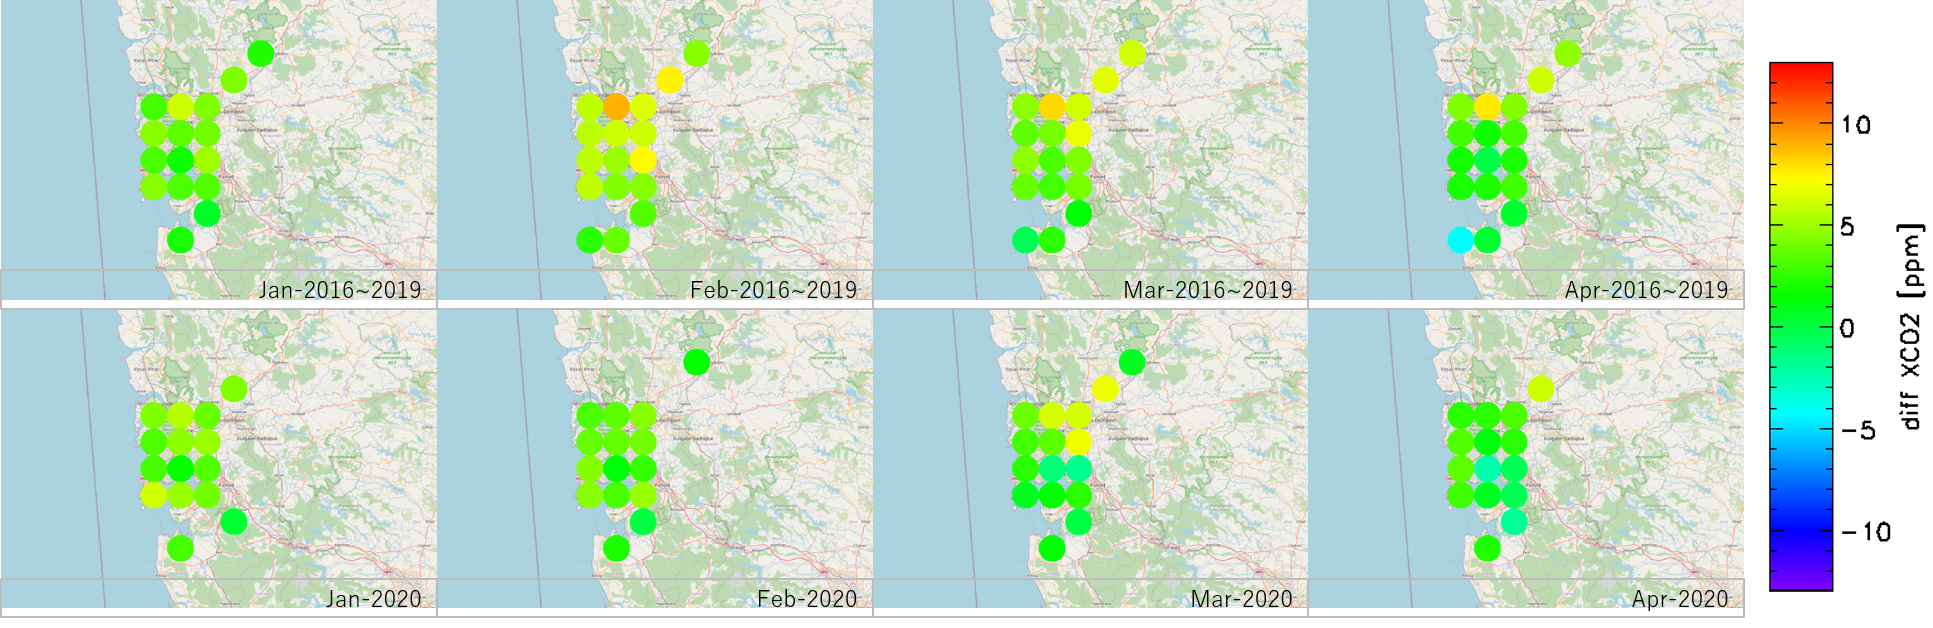
Fig 7-2: Monthly lower tropospheric CO2 enhancements map over Dhaka for January through April 2020 compared with the 2016-2019 monthly climatology
(GOSAT target observations are shown in color-coded circles of 10 km diameter field of view.)
Link
Detection of changes in methane concentration in Bakersfield, California, USA from the "IBUKI"
Last Update: 2021/3/31Overview
GOSAT observes the change of the tropospheric lower column of methane in Bakersfield, California, USA.
Observation and Analysis Results
Due to the stagnation of economic activity caused by the COVID-19 pandemic, oil demand fell sharply and crude oil prices plummeted in March 2020. Bakersfield, Kern County, California, has a thriving oil and gas mining, and the Kern County oil field has the highest oil production in the state. According to statistics from the US Energy Information Administration, California's crude oil production has been on a downward trend for several years, but it will continue to decline from March to June 2020 (Reference【1】).
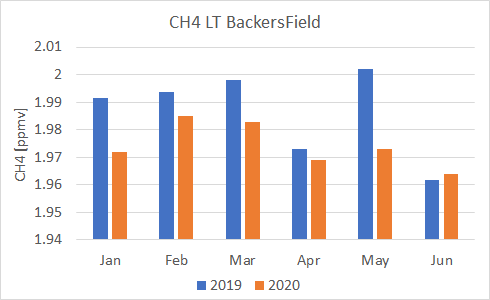
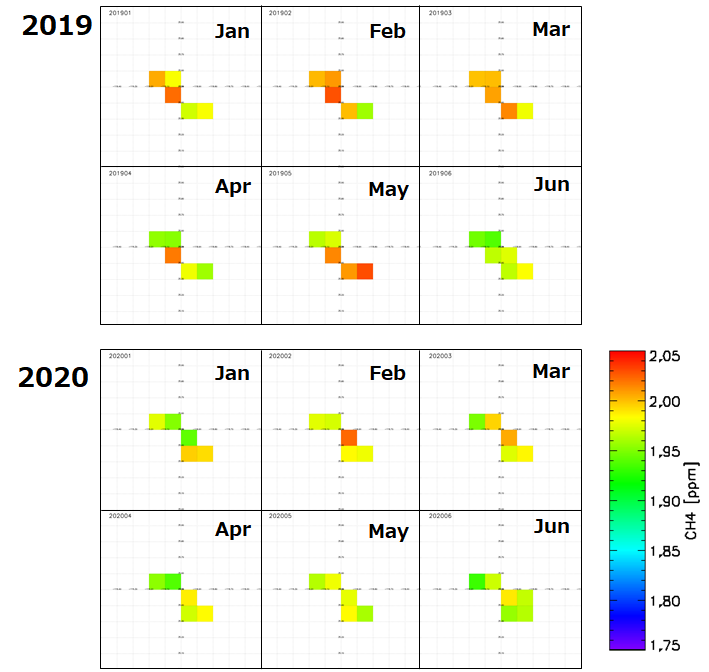
Bakersfield is located on the south side of the Central Valley of California and is surrounded by mountain ranges. Regarding the tropospheric lower column of methane concentration by GOSAT observation, the graph of the monthly average value from January to June 2019 to 2020 (Fig. 8-1) and the map of 0.1 degree grid / monthly average are shown (Fig. 8-2). Both months tend to be lower in 2020 than in 2019. According to the WMO Annual Report on Greenhouse Gases, the global average annual increase rate in methane over the last 10 years is about 0.01 ppmv (Reference【2】).
Analyzed by JAXA/EORC
Fig 8-1: Monthly tropospheric lower column of methane concentration around Bakersfield by GOSAT observations.
Analyzed by JAXA/EORC
Fig 8-2: Monthly tropospheric lower column of methane concentration map around Bakersfield by GOSAT observations.
Observation by GOSAT/GOSAT-2
GOSAT has the only asset of coincident solar and thermal measurements, which provide partial column information upper troposphere (4-12km) and lower troposphere (0-4 km). We then assumed that the upper partial column results represent background CO2 concentrations, which are less affected by the city, while the lower partial column results track the CO2 concentration changes within the city. If so, subtracting monthly averages the upper partial column values over the city from the lower partial column estimates should largely remove the seasonally-varying background values and yield and estimate of the CO2 enhancements near the surface over the city.
The GOSAT partial column products are provided in long term over 11 years with frequent target observations at large cities over 50 locations. JAXA GOSAT and GOSAT-2 will be collaborated with NASA OCO-2 and ESA TROPOMI to challenge to track the COVID-19 pandemic influence on greenhouse gas and air quality.
* GOSAT and GOSAT-2 are joint projects by JAXA, NIES and MOE.