Global CO2 Density Changes observed by "GOSAT"
Last Update: 2022/2/28Overview
GOSAT observes global CO2 enhancement changes. The CO2 enhancement in 2020 was smaller than 2019 in local regions, but it has slightly increased again in 2021. Simultaneous CH4 enhancement is also shown.
Observation and Analysis Results
The largest changes in economic activity associated with the COVID-19 pandemic have been reported in the world countries. The CO2 atmospheric change influenced by the human activity change is possibly seen in space-based measurement. We derived the global distribution of monthly averages of CO2 enhancements related to CO2 flux index in the months of February and March of 2019, 2020 and 2021 by using GOSAT CO2 tropospheric partial column density products. These data were averaged in 2.5-degree spatial grid of latitude and longitude, in monthly temporal trend. We can see some regional CO2 enhancement variations between before and after the COVID-19.
In the CO2 enhancement map, green shows nearly no emission and red and yellow show possible emission area. Compared to 2019, in February and March of 2020, CO2 enhancement was lower in China and Europe regions. In 2021, CO2 enhancement has slightly increased again than 2020. It seems to be affected by recovery of the human activity.
Global distribution of CH4 enhancements differ from that of CO2. This comes from the different local emission source type between CO2 and CH4. Compared to 2019, CH4 enhancement in 2020 was lower in Asia region. In 2021, China region has slightly increased again than 2020.
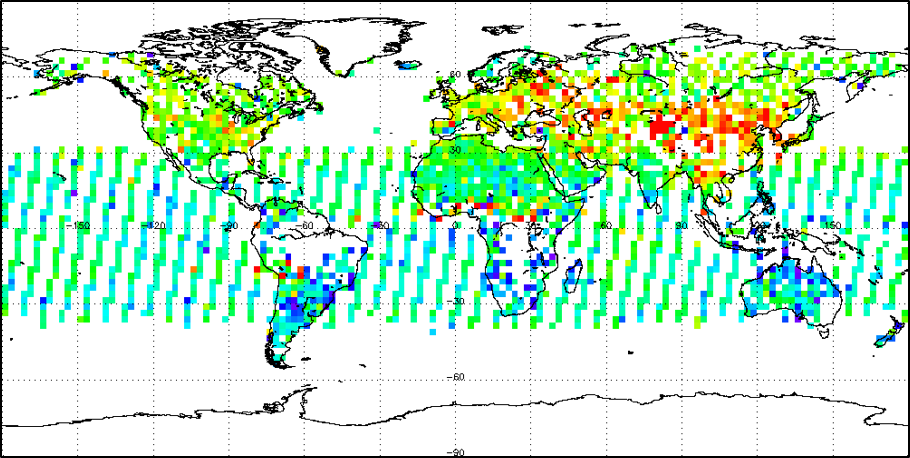
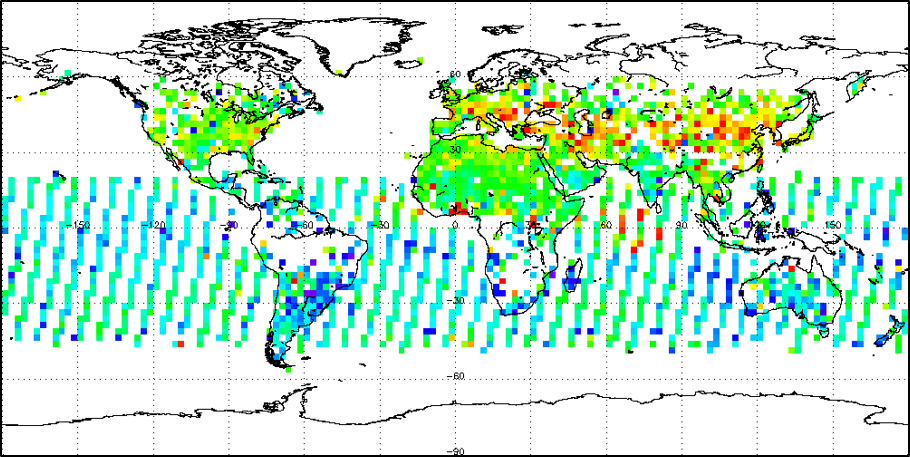
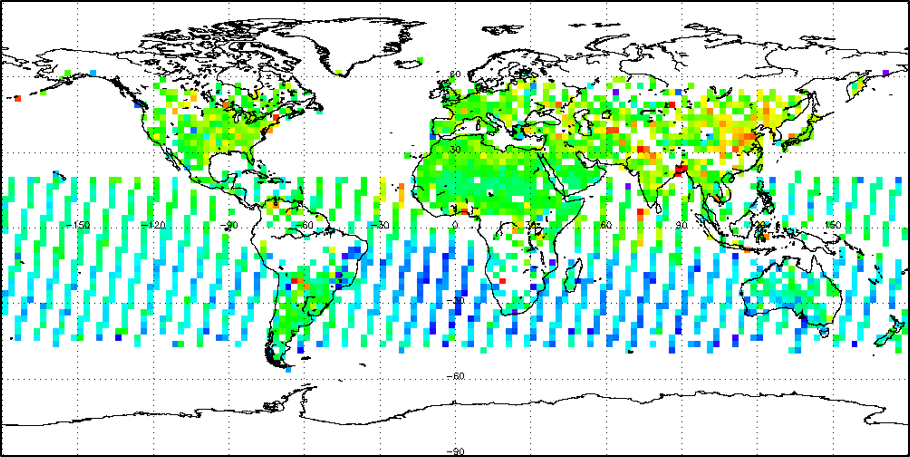
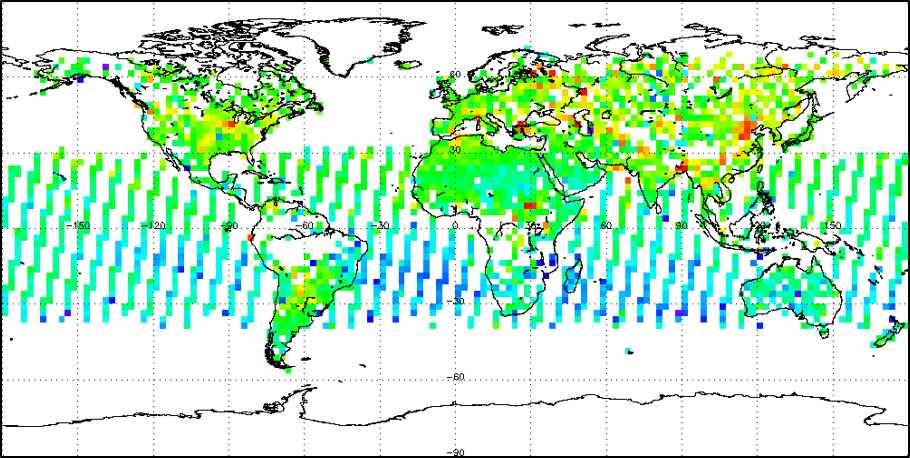
Observation and Analysis Results (CO2 density differences between lower and upper atmospheres)
Analyzed by JAXA/EORC
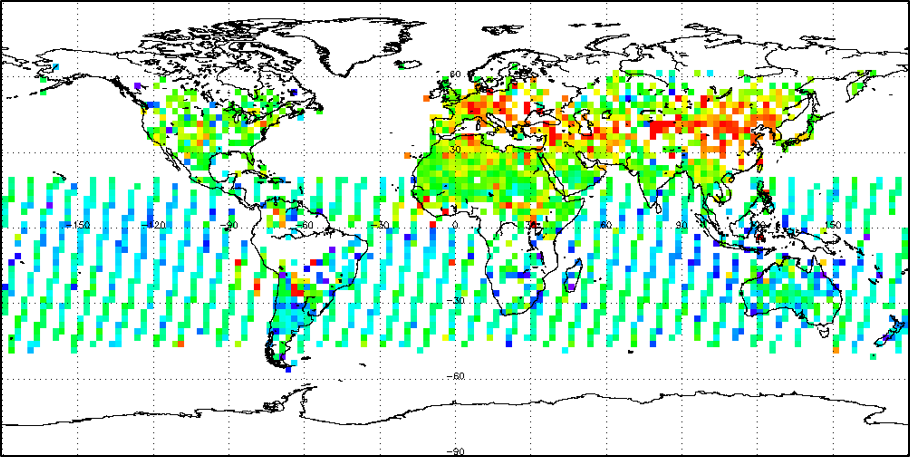
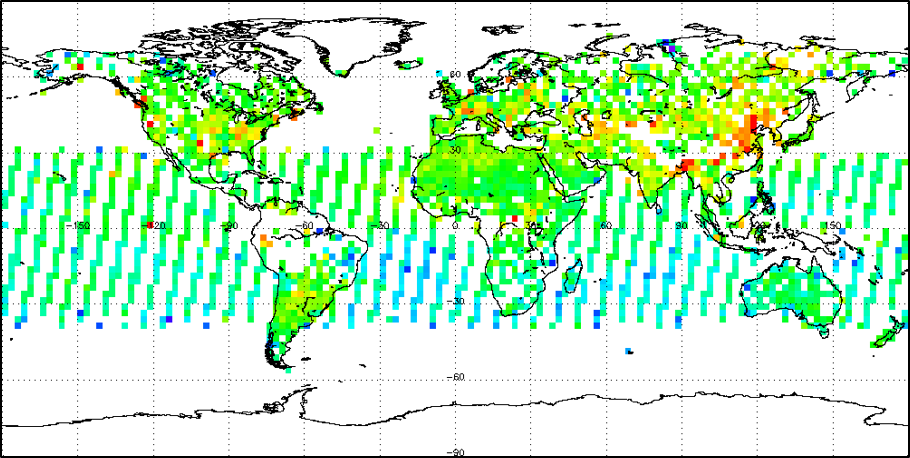
Fig 1-1: Global CO2 density differences between lower atmosphere minus upper atmosphere from GOSAT for February and March in 2019.
Analyzed by JAXA/EORC
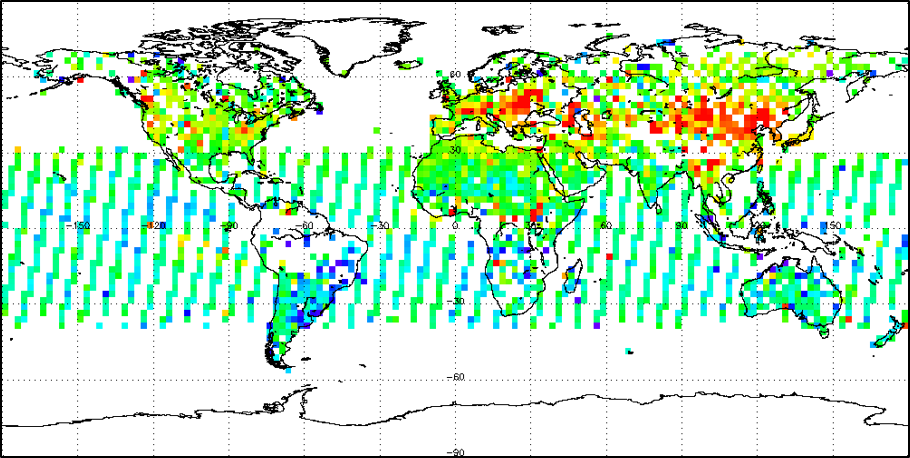
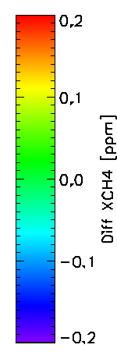
Fig 1-2: Global CO2 density differences between lower atmosphere minus upper atmosphere from GOSAT for February and March in 2020.
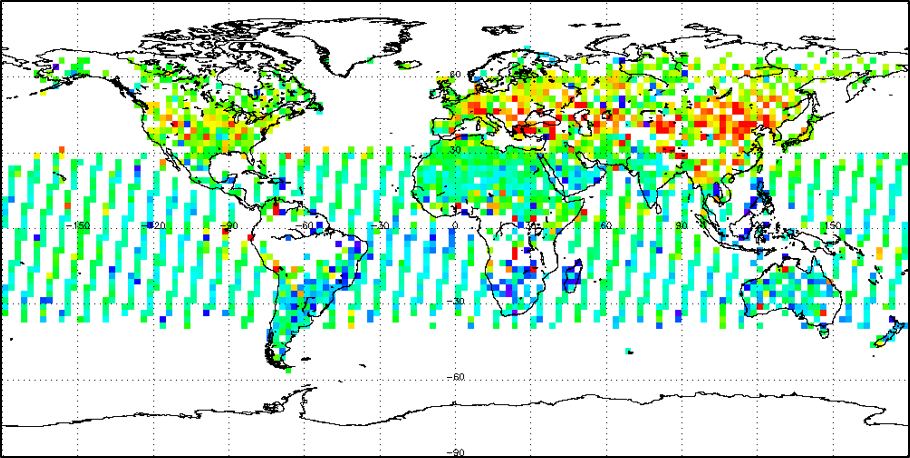
Analyzed by JAXA/EORC
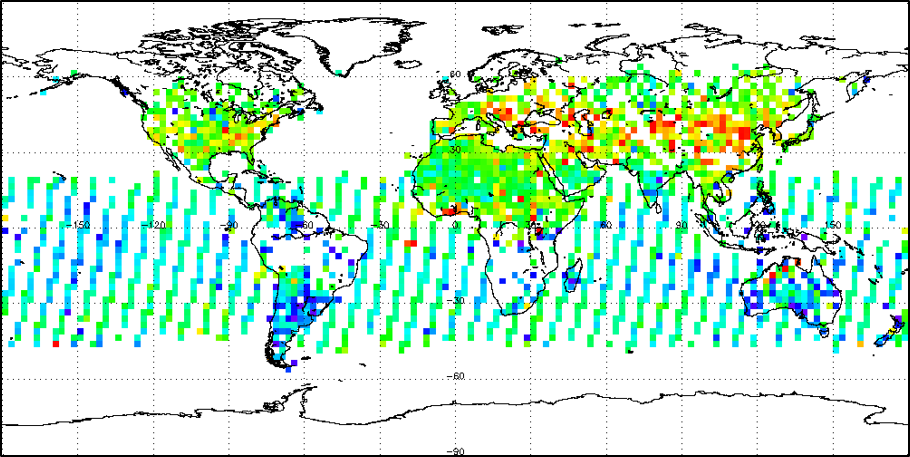
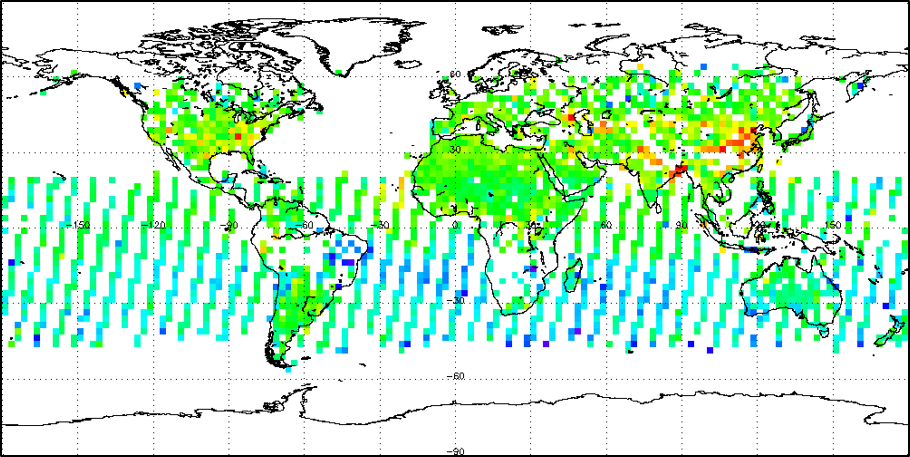
Fig 1-2: Global CO2 density differences between lower atmosphere minus upper atmosphere from GOSAT for February and March in 2021.
Observation and Analysis Results (CH4 density differences between lower and upper atmospheres)
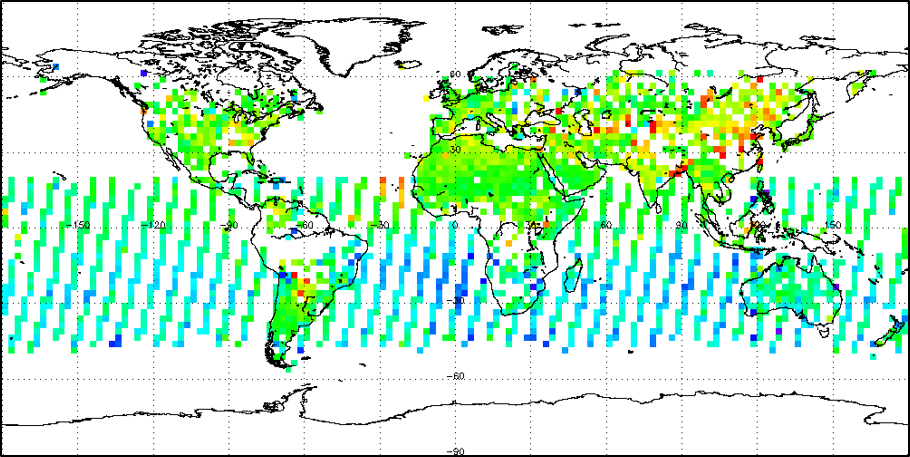
Analyzed by JAXA/EORC
Fig 2-1: Global CH4 density differences between lower atmosphere minus upper atmosphere from GOSAT for February and March in 2019.
Analyzed by JAXA/EORC
Fig 2-2: Global CH4 density differences between lower atmosphere minus upper atmosphere from GOSAT for February and March in 2020.
Analyzed by JAXA/EORC
Fig 2-2: Global CH4 density differences between lower atmosphere minus upper atmosphere from GOSAT for February and March in 2021.
Observation by GOSAT
GOSAT has the only asset of coincident solar and thermal measurements, which provide partial column information upper troposphere (4-12 km) and lower troposphere (0-4 km). We then assumed that the upper partial column results represent background CO2 concentrations, which are less affected by the city, while the lower partial column results track the CO2 concentration changes within the city. If so, subtracting monthly averages the upper partial column values over the city from the lower partial column estimates should largely remove the seasonally-varying background values and yield and estimate of the CO2 enhancements near the surface over the city.
The GOSAT partial column products are provided together with GOSAT-2 in global observations with frequent target observations at large cities over 50 locations. JAXA GOSAT and GOSAT-2 is collaborating with NASA OCO-2 and ESA TROPOMI to challenge to track the change on greenhouse gas and air quality.
* GOSAT and GOSAT-2 are joint projects by JAXA, NIES and MOE.