


Meteorology and the Environment
2012.08.25 Sat
A new record minimum of the Arctic sea ice extent
 |
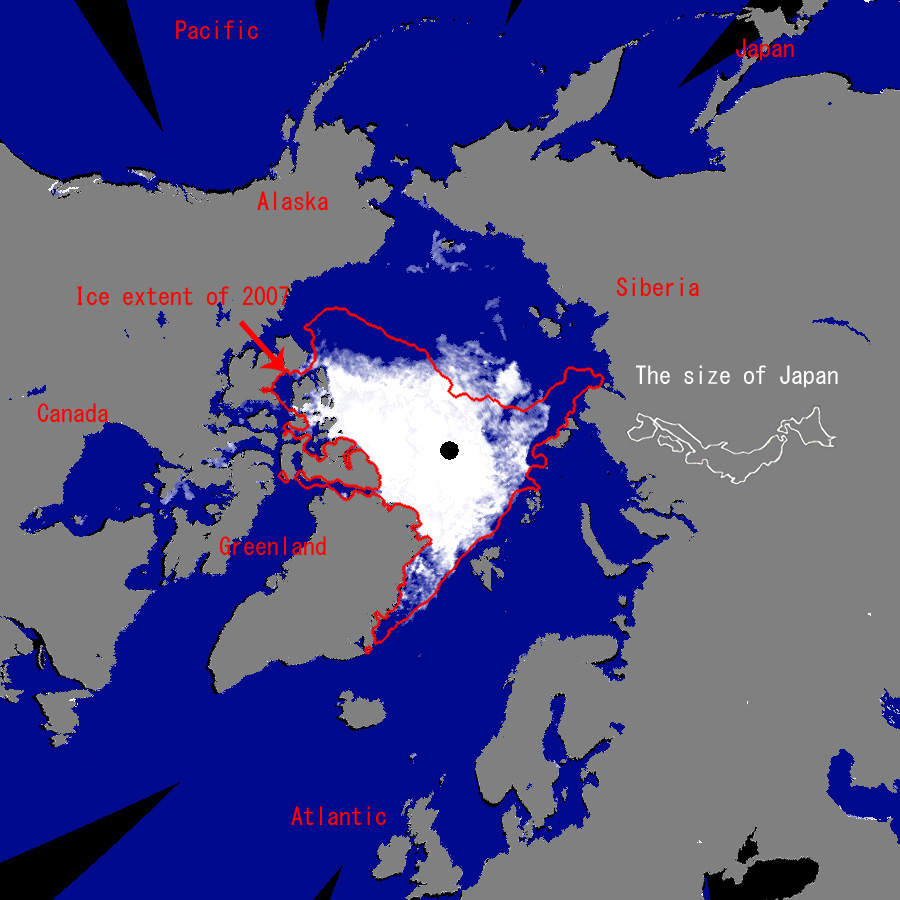 |
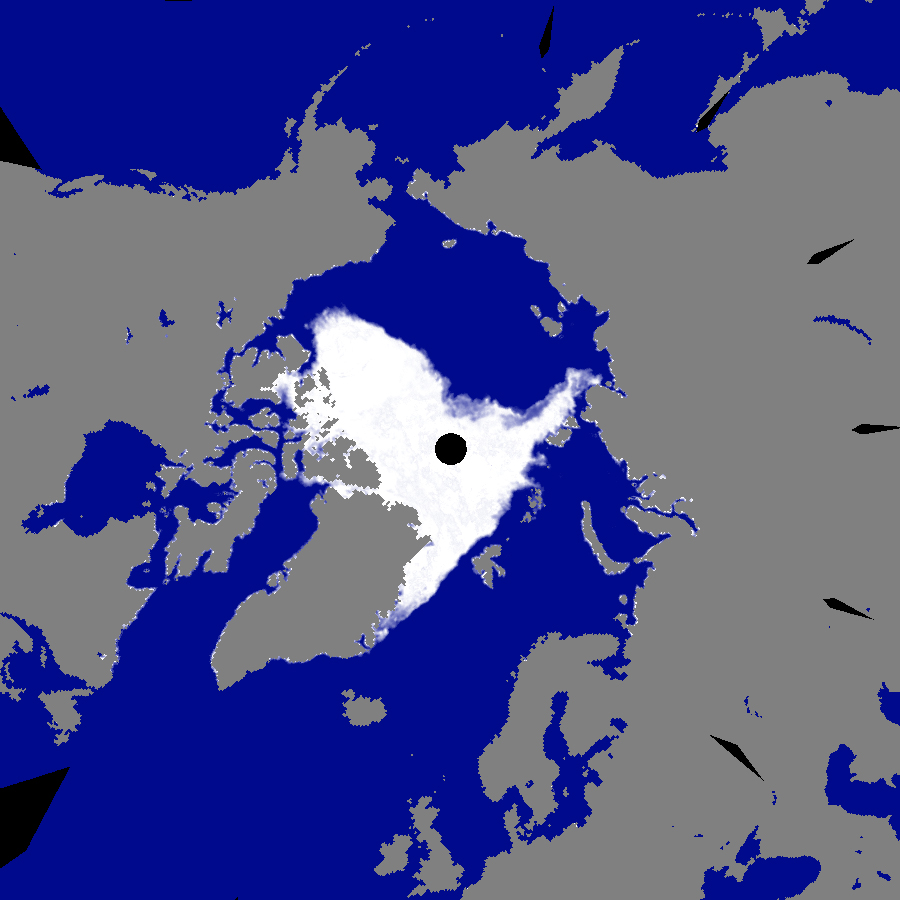
| Fig. 1a Arctic sea ice distribution captured on Sep. 24, 2007 by AMSR-E (absolute minimum recored). | Fig. 1b Arctic sea ice distribution captured on Aug. 24, 2012 by AMSR2. |
|
 |
| Fig. 1a Arctic sea ice distribution captured on Sep. 24, 2007 by AMSR-E (absolute minimum recored). | Fig. 1b Arctic sea ice distribution captured on Aug. 24, 2012 by AMSR2. |
caption on
caption off
Melt season in the Arctic Ocean came in the summer of 2012. The Arctic sea ice is shrinking at an unprecedented rate this year and set a record minimum. A record minimum sea-ice coverage of 4.21 million sq km was observed by satellite on 24 August 2012, one month earlier than previous minimum record set on 24 September, 2007.
| Fig. 2a Seasolan variation of the Arctic sea ice extent (updated on Aug. 24, 2012) |
Fig. 2b Zoom up of the square area in the left figure. |
Shrinking rate of the Arctic sea ice is still kept high. Every year the sea ice shrinking continues until around the middle of September. The annual minimum of sea ice extent this year is possible to be less than 4 million sq km.
Fig. 3 Daily rate of the Arctic sea ice extent variation
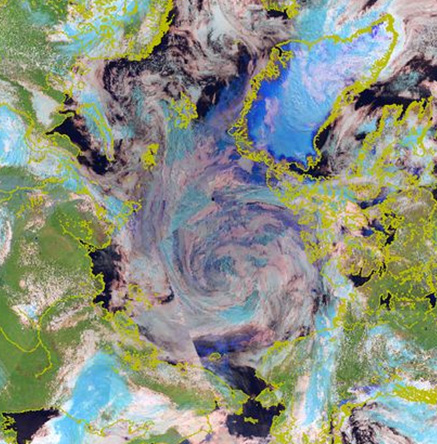
The Figure 3 shows the daily rate of sea ice extent variation during May to August in 2003 to this year. Positive value indicates the extension of sea ice extent and negative value indicates the sea ice shrinkage. This summer sudden reduction of the sea ice extent occurred at the beginning of August. This event was coincident with the occurrence of the giant polar low over the Arctic Ocean which was captured by NASA’s MODIS sensor (Fig. 4).


caption on
caption off
(Sea level pressure and wind vector data is provided by Japan Meteorological Agency)
The size of the polar low is about that of the Japan islands. AMSR2 captured well the scene of the rapid sea ice reduction under the giant low system as seen in Fig. 5 (animation). The Arctic sea ice extent continued to decrease in the middle of August and at last set the absolute minimum record on 24 August.
Fig .5 Animation of AMSR2 brightness temperature images
(Jul. 3-Aug. 24, 2012)
The shrinkage of the Arctic sea ice will continue for a while till the middle of September. JAXA has continued to monitor the Arctic sea ice and to report the latest information.
You can find the latest data and images of sea-ice extent in the Arctic Ocean as well as previous observation images on Arctic Sea-Ice Monitor in the IARC-JAXA information system (IJIS) maintained by JAXA and located at the International Arctic Research Center (IARC, Fairbanks, Alaska).(URL:http://www.ijis.iarc.uaf.edu/cgi-bin/seaice-monitor.cgi?lang=e)
Explanation of the Images:
(Fig. 1a)
| Satellite: | Earth Observing System (EOS), Aqua, NASA |
| Sensor: | Advanced Microwave Scanning Radiometer for EOS (AMSR-E) |
| Date: | September 24, 2007 |
(Fig. 1b)
| Satellite: | Shizuku (GCOM-W1) (JAXA) |
| Sensor: | Advanced Microwave Scanning Radiomet 2 (AMSR2), (JAXA) |
| Date: | August 24, 2012 |
Figure 1 shows the calculated concentration of sea ice based on the algorithm developed by one of the Principal Investigators (PI) for AMSR2 algorithm development, Dr. Josefino C. Comiso from NASA GSFC. The calculation uses 36.5-GHz and 18.7-GHz horizontal and vertical polarization data of the AMSR-E or AMSR2. The spatial resolution of Fig. 1 data is approximately 25km.
(Fig. 4)
| Satellite: | Earth Observing System (EOS), Aqua, NASA |
| Sensor: | Advanced Microwave Scanning Radiometer for EOS (AMSR-E) |
| Date: | August 7, 2012 |
Figures 4 shows RGB color composite of MODIS reflectance at band 7, 5, 2. The spatial resolution is approximately 5km.
(Fig. 5)
| Satellite: | Shizuku (GCOM-W1) (JAXA) |
| Sensor: | Advanced Microwave Scanning Radiomet 2 (AMSR2), (JAXA) |
| Date: | July 3 – August 24, 2012 |
Figure 5 shows animation of AMSR2 brightness temperature images. The RGB composite images using 36GHz-V、18GHz-V、89GHzPR (Polarization Ratio). The spatial resolution is approximately 5km.
・Arctic sea-ice second smallest on record
・Arctic Sea Ice getting thinner and thinner
・Confirmed record minimum Arctic sea ice
・Arctic sea-ice area smallest on record
Search by Year
Search by Categories


Tags
-
#Earthquake
-
#Land
-
#Satellite Data
-
#Aerosol
-
#Public Health
-
#GCOM-C
-
#Sea
-
#Atmosphere
-
#Ice
-
#Today's Earth
-
#Flood
-
#Water Cycle
-
#AW3D
-
#G-Portal
-
#EarthCARE
-
#Volcano
-
#Agriculture
-
#Himawari
-
#GHG
-
#GPM
-
#GOSAT
-
#Simulation
-
#GCOM-W
-
#Drought
-
#Fire
-
#Forest
-
#Cooperation
-
#Precipitation
-
#Typhoon
-
#DPR
-
#NEXRA
-
#ALOS
-
#GSMaP
-
#Climate Change
-
#Carbon Cycle
-
#API
-
#Humanities Sociology
-
#AMSR
-
#Land Use Land Cover
-
#Environmental issues
-
#Quick Report
Related Resources


Meteorology and the Environment Related Articles
-
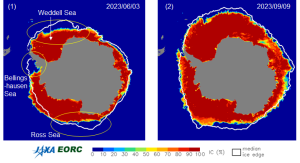 Meteorology and the Environment 2023.10.11 Wed Climate Change 2023 (2) : Antarctic Winter Sea Ice Extent Lowest Ever Recorded
 -
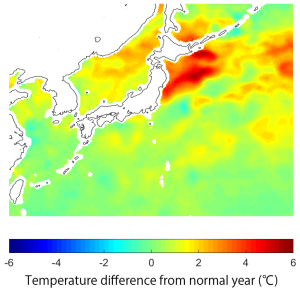 Meteorology and the Environment 2023.08.31 Thu Climate Change 2023 (1) : Sea Surface Temperature Rise and El Niño Event
 -
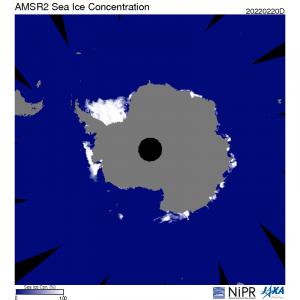 Meteorology and the Environment 2022.04.28 Thu Antarctic Sea Ice Extent Lowest Ever Recorded
 -
 Meteorology and the Environment 2022.04.22 Fri Earth Day ~Caring about our Earth~
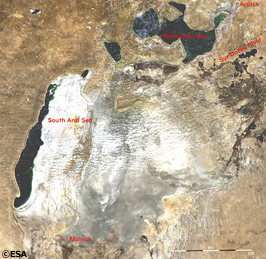
“The disappearing lake, and the appearing crater”
Stay Connected
